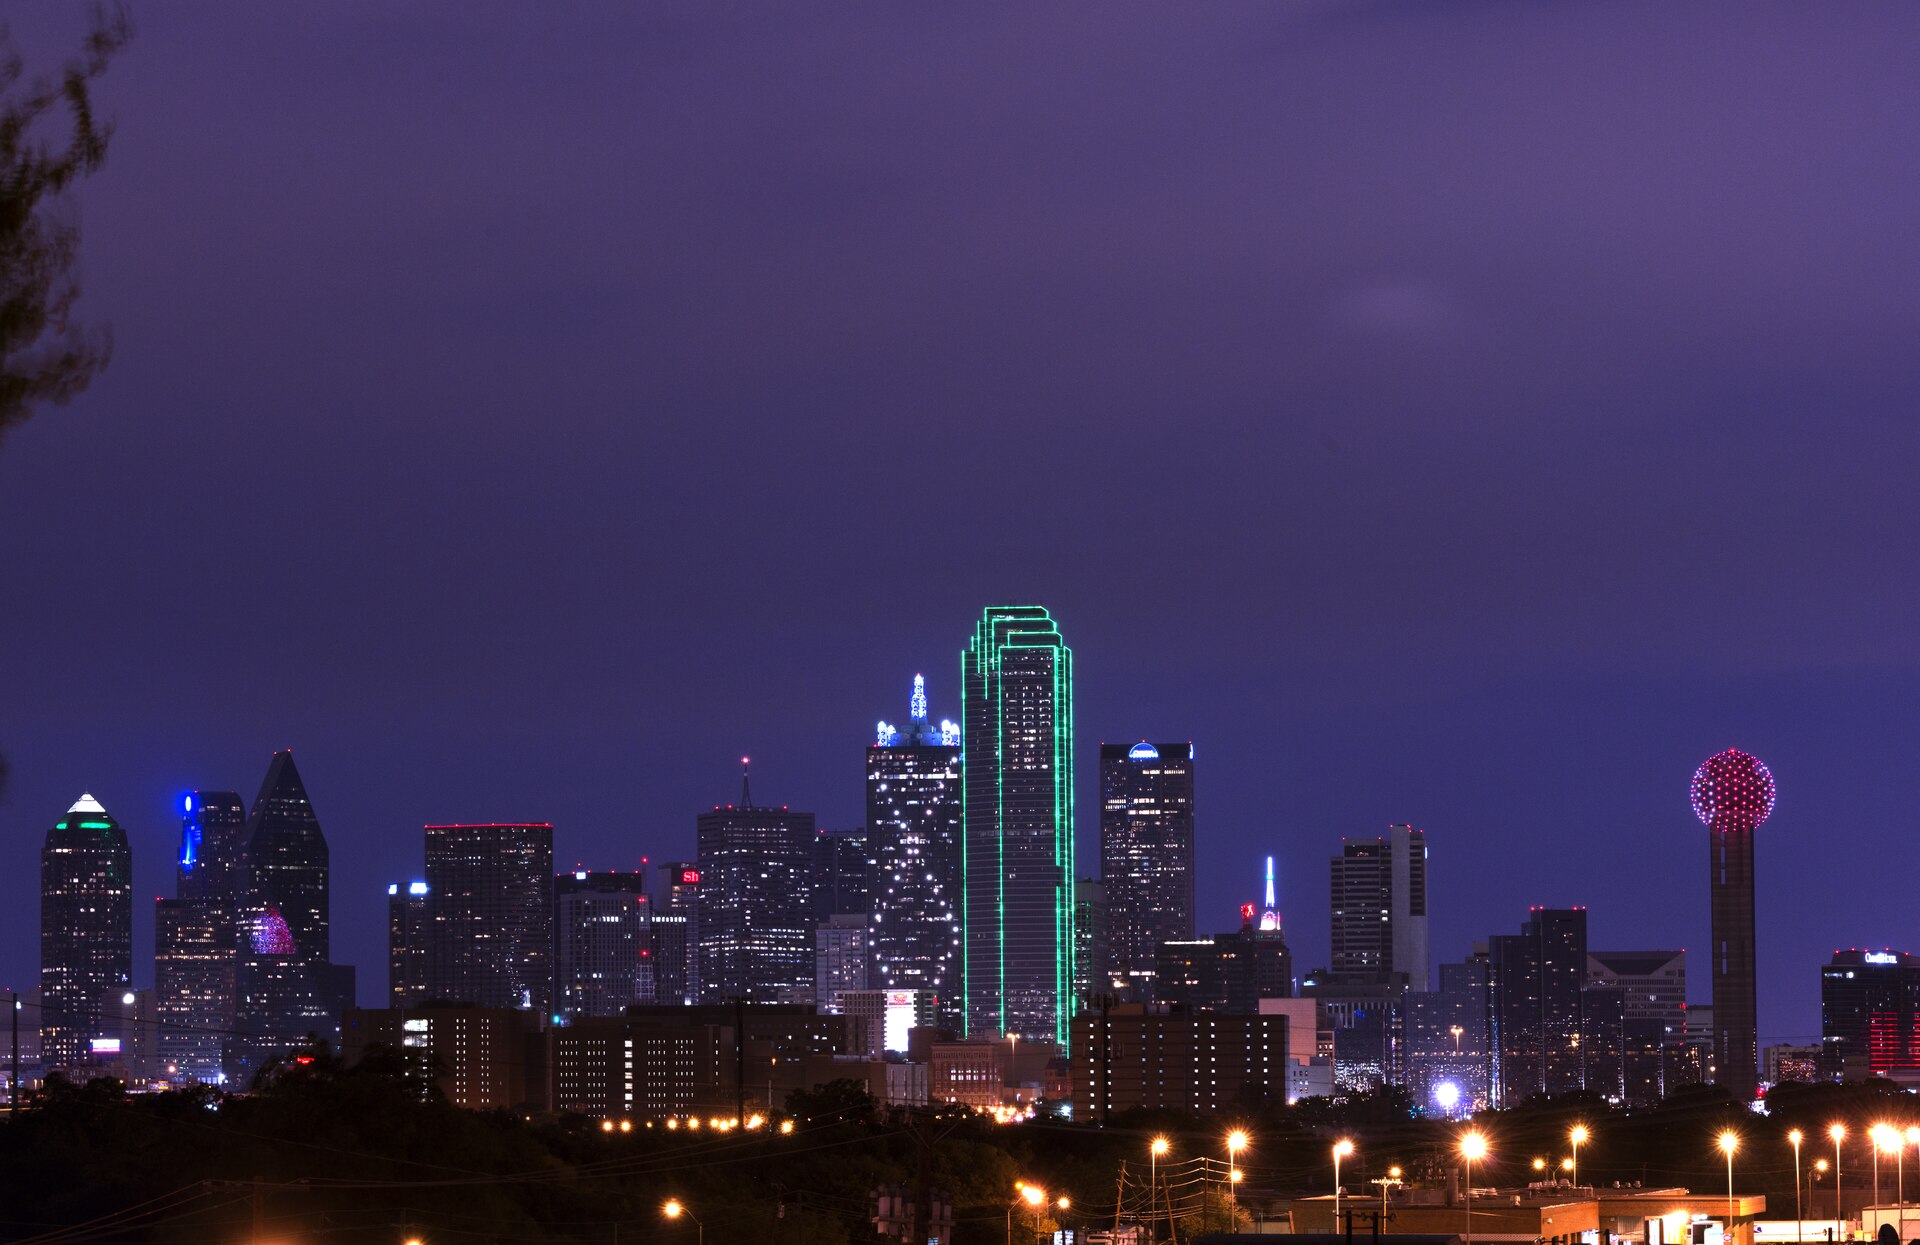
The downtown Dallas skyline at dusk. Photo: Carol M. Highsmith, Library of Congress, via Wikimedia Commons. License: Public domain.
Quick Answer: The Dallas-Fort Worth office market tightened again in the third quarter of 2026. CBRE put metro vacancy at 24.6%, down 40 basis points from the prior quarter, with about 1 million square feet of net absorption and 2.52 million square feet of leasing. Cushman & Wakefield counted 4.4 million square feet of leasing, the most in a quarter since early 2019, and sublease availability at its lowest level since mid-2020.
The third-quarter 2026 reports from the major brokerages show a Dallas-Fort Worth office market on the mend. Vacancy is still high, roughly one in four square feet, but it is falling, sublease space is shrinking and asking rents keep climbing.
The data below draws on third-quarter 2026 research from CBRE, Cushman & Wakefield and Kidder Mathews, along with Yardi Matrix figures reported in November. Each firm defines its inventory differently, so the numbers do not match exactly, but the direction is consistent.
What is the DFW office vacancy rate as of Q3 2026?
CBRE’s Dallas/Fort Worth office figures for the third quarter of 2026, published October 9, put the metro vacancy rate at 24.6%, down 40 basis points from the second quarter. CBRE’s availability rate, which counts space being marketed for lease even if it is still occupied, fell 130 basis points to 26.6%.
Cushman & Wakefield’s third-quarter MarketBeat reported overall vacancy of 23.7%, down 20 basis points from the prior quarter and 150 basis points from a year earlier. The firm said this was the seventh consecutive quarterly decline. Its Class A vacancy rate stood at 25.3%, while vacancy in trophy buildings, the top tier of the market, was 19.2%.
Kidder Mathews, which tracks a 222.5 million-square-foot Dallas-area inventory that includes Fort Worth submarkets, reported total vacancy of 24.8% in the third quarter, down from 25.4% in the second quarter and 25.7% a year earlier. Its availability rate was 27.6%.
Yardi Matrix, which uses a narrower definition of competitive office stock, reported a lower Dallas-Fort Worth vacancy rate of 18.6% in September, down 360 basis points over 12 months, according to a November 6 CRE Daily report on the data. That compared with a national rate of 17.8% in the same Yardi data.
How do the major Q3 2026 reports compare?
| Metric (Q3 2026) | CBRE | Cushman & Wakefield | Kidder Mathews |
|---|---|---|---|
| Vacancy rate | 24.6% | 23.7% | 24.8% |
| Quarterly change | -40 bps | -20 bps | -60 bps |
| Net absorption | 1.00 million sq. ft. | 156,935 sq. ft. | 125,387 sq. ft. |
| Leasing volume | 2.52 million sq. ft. | 4.4 million sq. ft. | 4.48 million sq. ft. |
| Average asking rent | $35.09/sq. ft. | $34.14/sq. ft. | $34.70/sq. ft. (direct) |
| Under construction | 3.48 million sq. ft. | 2.5 million sq. ft. | 2.85 million sq. ft. |
Source: CBRE Dallas/Fort Worth Office Figures Q3 2026; Cushman & Wakefield DFW Office MarketBeat Q3 2026; Kidder Mathews Dallas Office Market Report 3Q 2026. Figures reflect each firm’s own inventory and methodology.
How much office space did DFW tenants absorb in Q3 2026?
Net absorption, the change in occupied space, stayed positive across all three brokerage reports, though the size of the gain varied widely. CBRE recorded 1.00 million square feet of positive net absorption in the third quarter, up from 916,000 square feet in the second quarter.
Cushman & Wakefield measured a smaller gain of 156,935 square feet, but noted that it was the seventh consecutive positive quarter and brought year-to-date absorption to 1.4 million square feet. Class A buildings accounted for 234,054 square feet of positive absorption in the firm’s count, while Class B and C properties were slightly negative.
Kidder Mathews reported 125,387 square feet of net absorption for the quarter and 829,923 square feet for the year to date, down 59.8% from the 2.06 million square feet it recorded through the first three quarters of 2025. Class A properties absorbed 525,756 square feet in the third quarter, while Class B buildings gave back 400,369 square feet.
Why are newer buildings outperforming older ones?
The gap between top-tier and older buildings has become the defining feature of the DFW office market. In Kidder Mathews’ data, Class A space has absorbed more than 1.13 million square feet so far in 2026, while Class B space has lost 302,301 square feet. Cushman & Wakefield’s trophy vacancy rate of 19.2% sits well below its overall rate.
Earlier in 2026, Cushman & Wakefield research cited by REjournals in June put average trophy office rents in DFW at about $77 per square foot, compared with about $37 for the rest of the Class A market, and said the spread between the two had widened from $25 to $40 per square foot since 2020.
How strong was DFW office leasing in Q3 2026?
Leasing activity was the standout figure of the quarter. Cushman & Wakefield reported 4.4 million square feet of leasing, up 30.3% from the second quarter and the highest quarterly total since the first quarter of 2019. Year-to-date new commitments reached 11.6 million square feet, and the financial activities sector led with 3.2 million square feet.
CBRE counted 2.52 million square feet of leasing in the third quarter, up from 1.80 million square feet in the second quarter. Kidder Mathews recorded 4.48 million square feet leased in the quarter and 11.66 million square feet for the year to date, a 7.0% decrease from the same period in 2025.
What were the largest DFW office leases in Q3 2026?
Kidder Mathews’ third-quarter report lists several large transactions, led by financial firms and telecommunications. The figures below come from that report, and transaction details may differ from those reported by other brokerages.
| Tenant | Address | Submarket | Square feet | Type |
|---|---|---|---|---|
| Morgan Stanley | 2401 McKinney Ave. | Uptown/Turtle Creek | 708,000 | New |
| AT&T | 2201 Lakeside Blvd. | Richardson/Plano | 183,242 | New |
| Depository Trust & Clearing Corp. | 9001 Cypress Waters Blvd. | Las Colinas | 133,786 | New |
| Morgan Stanley | 1445 Ross Ave. | Dallas CBD | 123,913 | New |
| Frost Bank | 2950 N. Harwood St. | Uptown/Turtle Creek | 88,291 | Renewal |
Source: Kidder Mathews Dallas Office Market Report 3Q 2026.
CRE Daily, summarizing CBRE’s third-quarter data, reported that the top lease in CBRE’s count was a 376,000-square-foot AT&T renewal in the Richardson/Plano area, followed by two confidential deals of 183,000 and 124,000 square feet. Separately, Yardi Matrix data reported by CRE Daily noted a 172,089-square-foot lease by Mercury One in Irving, which Cushman & Wakefield described as the largest new office lease in Las Colinas since 2021.
How much sublease space is left in DFW?
Sublease space, offices that tenants are trying to offload before their leases expire, was one of the clearest signals of weakness after 2020. It is now receding. Cushman & Wakefield reported 5.3 million square feet of sublease availability in the third quarter of 2026, the lowest level since the second quarter of 2020.
A shrinking sublease pool matters for two reasons. It removes discounted competition for landlords leasing direct space, and it suggests companies are holding on to space they once planned to shed.
What does the DFW office construction pipeline look like?
The construction pipeline is small by historical standards but growing, and it is concentrated in a few high-end submarkets. CBRE reported 3.48 million square feet under construction at the end of the third quarter, up from 2.98 million square feet in the second quarter, and noted that no new space was delivered during the quarter. CRE Daily, citing the CBRE data, reported that the DFW pipeline was the second-largest in the country behind Manhattan.
Cushman & Wakefield described its count of 2.5 million square feet under way as historically low, and said only 280,813 square feet is scheduled to deliver in 2026, the smallest annual total since 2011. Two projects totaling 338,685 square feet began foundation work during the third quarter, according to the firm.
Which major office projects are under construction?
| Project | Submarket | Square feet | Expected delivery |
|---|---|---|---|
| Goldman Sachs campus | Uptown/Turtle Creek | 800,000 | 1Q 2028 |
| Bank of America Tower at Parkside | Uptown/Turtle Creek | 500,126 | 1Q 2027 |
| Fields West | Frisco/The Colony | 451,036 | 2Q 2027 |
| The Knox | Preston Center | 206,000 | 4Q 2026 |
| 2626 McKinney | Uptown/Turtle Creek | 180,842 | 1Q 2028 |
Source: Kidder Mathews Dallas Office Market Report 3Q 2026.
The Goldman Sachs campus is the largest single project. Yardi Matrix data reported by CRE Daily valued the 800,000-square-foot NorthEnd campus at $709 million, backed by a $513.9 million construction loan from JPMorgan Chase, with completion expected in early 2028. Kidder Mathews counts 1.48 million square feet under construction in Uptown/Turtle Creek alone, more than half of its total Dallas pipeline.
Which DFW office submarkets are strongest?
Uptown and the northern suburbs continue to lead, while parts of downtown Dallas and older suburban corridors lag. Cushman & Wakefield said Uptown/Turtle Creek led the metro in third-quarter absorption with 209,584 square feet, and that construction began on Knox & McKinney, a 271,786-square-foot project. Legacy/Frisco absorbed 179,490 square feet, and construction started on Fields West Building L, a 66,899-square-foot building. South Fort Worth absorbed 71,709 square feet, with gains tied to new construction.
CRE Daily’s summary of CBRE data said Far North Dallas posted the strongest demand of the quarter with 733,000 square feet of net move-ins.
How do vacancy and rents vary by submarket?
| Submarket | Total vacancy | Q3 absorption (sq. ft.) | Asking rent ($/sq. ft.) |
|---|---|---|---|
| Preston Center | 5.8% | -6,537 | $66.84 |
| Uptown/Turtle Creek | 20.8% | +132,296 | $63.02 |
| Far North Dallas | 23.6% | +251,942 | $37.98 |
| Las Colinas | 28.4% | +335,839 | $33.38 |
| Richardson/Plano | 22.4% | -328,715 | $26.31 |
| Dallas CBD | 33.8% | -107,503 | $30.93 |
| Fort Worth CBD | 12.4% | -10,356 | $35.97 |
| Northeast Fort Worth | 43.0% | -224,621 | $24.83 |
Source: Kidder Mathews Dallas Office Market Report 3Q 2026 (selected submarkets).
Preston Center has the lowest vacancy in Kidder Mathews’ data and the highest asking rent. Uptown/Turtle Creek commands rents above $63 per square foot despite vacancy near 21%, a reflection of how much of its inventory is new trophy product. The Dallas central business district, at 33.8% total vacancy, recorded negative absorption in the quarter. In Fort Worth, the downtown core reported one of the lowest vacancy rates in the region at 12.4%, while Northeast Fort Worth’s 43.0% vacancy is the highest of any submarket in the report.
How much are DFW office rents rising?
Asking rents rose again in the third quarter. CBRE’s average asking rent increased to $35.09 per square foot from $34.82 in the second quarter. Kidder Mathews reported a direct asking rent of $34.70, up 6.1% from $32.70 a year earlier, with Class A space at $39.27 and Class B at $25.37.
Cushman & Wakefield’s overall asking rent was $34.14 per square foot, up 1.4% from a year earlier, and its Class A asking rent reached a record $39.94. The firm said building-level rent growth averaged 4.0% year over year. Concessions remain part of the picture: Cushman & Wakefield reported that new leases typically include one month of free rent and a tenant improvement allowance of $5 to $10 per square foot per year.
Investors are also returning. Yardi Matrix data reported by CRE Daily showed $3.7 billion in DFW office sales through September, the third-highest total among the 25 largest U.S. markets, at an average of about $196 per square foot. Kidder Mathews counted 14.1 million square feet of office space sold year to date, up 30.7% from the same period in 2025.
What does the Q3 2026 data mean for DFW businesses?
For companies shopping for space, the market is splitting into two. Tenants seeking trophy space in Uptown, Preston Center or Legacy/Frisco face shrinking options and rising rents. Cushman & Wakefield’s projection that only about 281,000 square feet will deliver in 2026 means little fresh supply is arriving to relieve that pressure before larger projects open in 2027 and 2028.
Tenants willing to consider older Class B buildings, or submarkets with higher vacancy such as the Dallas CBD, Las Colinas or parts of Fort Worth, still have leverage, including free rent and improvement allowances. For landlords of those older properties, falling sublease availability removes one source of cut-rate competition, but continued negative absorption in Class B space shows that the recovery has not reached them evenly.
Frequently Asked Questions
What is the DFW office vacancy rate in late 2026?
Third-quarter 2026 reports put it between about 23.7% and 24.8% depending on the firm: CBRE reported 24.6%, Cushman & Wakefield 23.7% and Kidder Mathews 24.8%. Yardi Matrix, using a narrower inventory, reported 18.6% in September.
Is the DFW office market recovering?
The main indicators are improving. Vacancy has declined for seven straight quarters in Cushman & Wakefield’s data, net absorption remains positive, leasing reached its highest quarterly level since 2019 and sublease availability is the lowest since mid-2020.
Which DFW office submarket has the highest rents?
In Kidder Mathews’ third-quarter 2026 data, Preston Center had the highest average asking rent at $66.84 per square foot, followed by Uptown/Turtle Creek at $63.02.
How much office space is under construction in Dallas-Fort Worth?
Estimates range from 2.5 million square feet (Cushman & Wakefield) to 3.48 million square feet (CBRE). The largest project is Goldman Sachs’ 800,000-square-foot Uptown campus, expected in early 2028.
How much sublease space is available in DFW?
Cushman & Wakefield reported 5.3 million square feet of sublease availability in the third quarter of 2026, the lowest since the second quarter of 2020.
Sources and Further Reading
- Dallas/Fort Worth Office Figures Q3 2026 — CBRE
- Dallas-Fort Worth Office MarketBeat Q3 2026 — Cushman & Wakefield
- Dallas Office Market Report 3Q 2026 — Kidder Mathews
- DFW Office Vacancy Drops to 24.6% With No New Deliveries — CRE Daily
- Dallas Office Vacancy Falls 360 bps to 18.6% (Yardi Matrix data) — CRE Daily
- Trophy Divide: How Texas Office Split Into Two Markets Running on Different Rules — REjournals